Metrics & Dashboard
You can track your billing usage of your organization with BlendVision's analytics module and pre-built dashboard.
Metrics
| Metrics | Units | Definition | Dimension |
|---|---|---|---|
| CDN | GB | The CDN consumption. | Streaming Type: |
| Storage | GB | The storage usage. | Asset Type: |
| Encoding | GB | The encoding consumption. | VOD Type: |
| Livestream | hrs | The duration of livestream, including the preview and the duration within start time to end time. | Livestream Type: |
| DRM Request | - | The times of DRM request. | - |
Dashboard
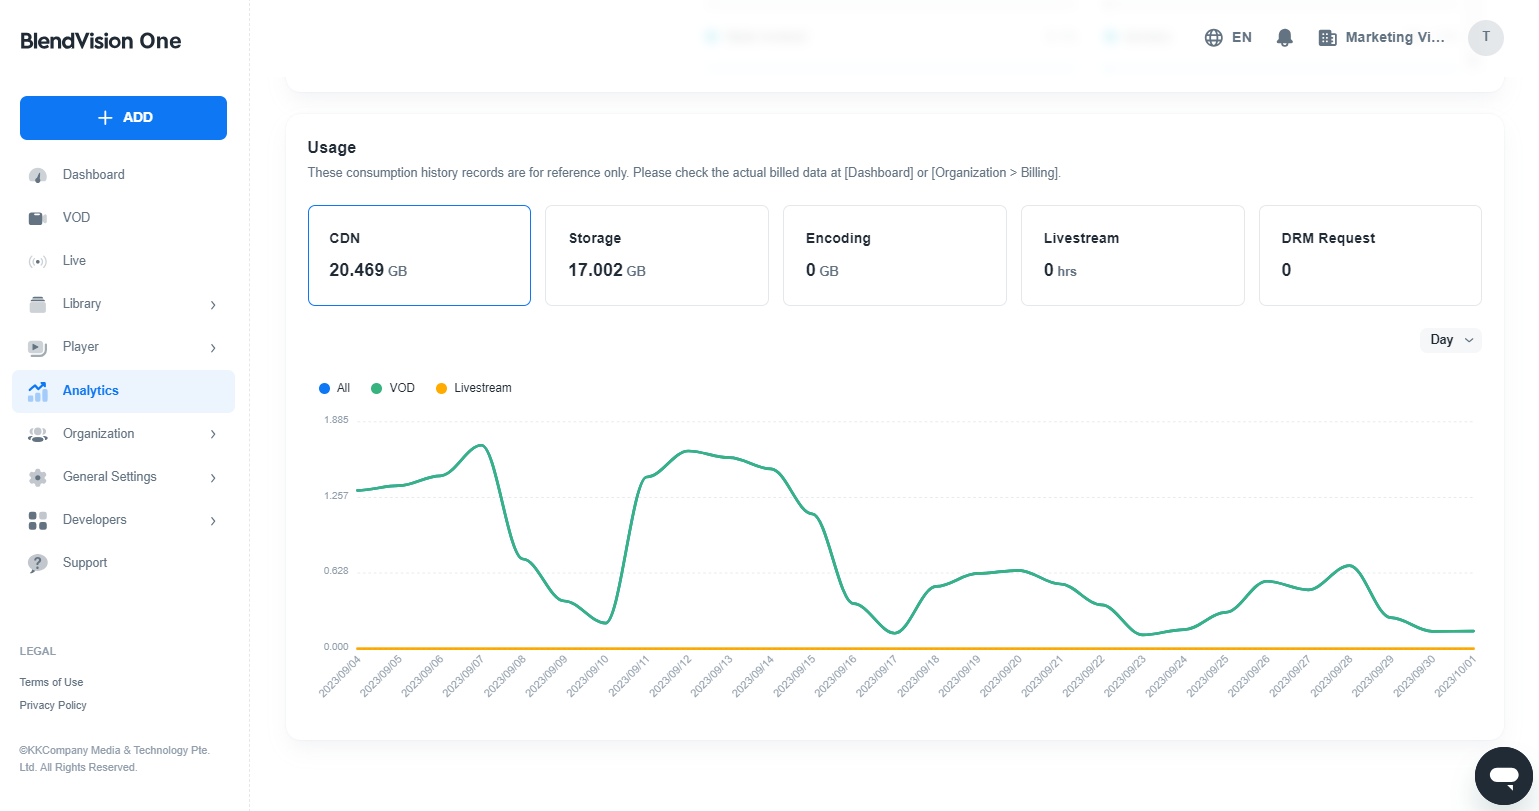
Login to your BlendVision One console > Navigate to Analytics
In the Overview tab, you can obtain the time series analysis of the metrics

These consumption history records are for reference only. Please check the actual billed data in your BlendVision One console at Organization > Billing.
Generate Summary Reports via API
Create the summary Report
To generate a summary report, you can use the following API:
POST bv/analytics/v1/summary/reports
You can specify allowed values for each parameter in the request:
| Field | Required | Description |
|---|---|---|
type | Yes | The resource type for the report. Allowed values:
|
dimension_with_conditions | Yes | An array of dimensions with conditions for the report. |
Dimension with Conditions
| Field | Required | Description |
|---|---|---|
dimension | Yes | Currently, only SUMMARY_REPORT_DIMENSION_METRICS is supported. |
interval | Yes | The time interval for the report, which defines the period for which data is aggregated. This object contains the following fields: |
start_time: The inclusive start of the interval, represented in ISO 8601 format (e.g., YYYY-MM-DDTHH:MM:SSZ). If specified, the timestamp for the data must be the same as or later than this time.end_time: The exclusive end of the interval, also represented in ISO 8601 format. If specified, the timestamp for the data must be earlier than this time. |
Here is an example of a request payload to generate a summary report:
{
  "type": "EVENT_TYPE_VOD",
  "dimension_with_conditions": [
    {
      "dimension": "SUMMARY_REPORT_DIMENSION_METRICS",
      "interval": {
        "start_time": "2024-11-30T16:00:00.000Z",
        "end_time": "2024-12-31T16:00:00.000Z"
      }
    }
  ]
}
You can request multiple reports with specified dimensions and conditions simultaneously. Upon a successful request, the API will generate the summary report and return a response containing the report ID(s):
{
  "reports": [
    {
      "id": "eyJ1aWQiOiI4MmEzZjNhYy04YmVkLTRjMTMtOTA3NC0xZDNlYmVhYzA2MGIiLCJvcmdfaWQiOiJjYTRmOTZjYS03M2NjLTRhMmItYTA1NC1jYTNjN2ZiOWIyMzUiLCJ0eXBlIjoidm9kIiwic3RhcnRfZGF0ZSI6IjIwMjQwNTEwIiwibGFzdF9kYXRlIjoiMjAyNTAxMTUifQ",
    }
  ]
}
Fetching Download URLs and Handling Multiple Reports
Once you have the report IDs, you can fetch the summary reports via the following API:
GET /bv/analytics/v1/summary/reports:batch-get
When making a request to the batch get endpoint, you need to provide the following parameters:
| Field | Required | Description |
|---|---|---|
id | Yes | The resource type for the report. Allowed values:
|
dimension_with_conditions | Yes | An array of dimensions with conditions for the report. |
Dimension with Conditions
| Field | Required | Description |
|---|---|---|
dimension | Yes | Currently, only SUMMARY_REPORT_DIMENSION_METRICS is supported. |
interval | Yes | The time interval for the report, which defines the period for which data is aggregated. This object contains the following fields: |
start_time: The inclusive start of the interval, represented in ISO 8601 format (e.g., YYYY-MM-DDTHH:MM:SSZ). If specified, the timestamp for the data must be the same as or later than this time.end_time: The exclusive end of the interval, also represented in ISO 8601 format. If specified, the timestamp for the data must be earlier than this time. |
Here is an example of a request payload to generate a summary report:
{
  "reports": [
    {
      "id": "string",
      "dimension": "SUMMARY_REPORT_DIMENSION_METRICS",
      "interval": {
        "start_time": "2024-11-30T16:00:00.000Z",
        "end_time": "2024-12-31T16:00:00.000Z"
      }
    }
  ]
}
The response from the batch get API will contain an array of reports. Each report will have the following structure:
{
  "reports": [
    {
      "id": "string",
      "uri": "string",
      "status": "EVENT_REPORT_STATUS_RUNNING"
    }
  ]
}
The fields in the report object are:
id: A unique identifier for the report.uri: The URI to download the report (available only if the report has succeeded).status: The current status of the report. Possible values include:EVENT_REPORT_STATUS_RUNNING: The report is still being processed.EVENT_REPORT_STATUS_SUCCEEDED: The report is ready for download.EVENT_REPORT_STATUS_FAILED: The report generation has failed.
When processing the response, follow these steps:
Iterate Through the Reports: You need to iterate through the array of reports to process each one individually.
Check the Status of Each Report: Implement logic to handle the different statuses of the reports:
EVENT_REPORT_STATUS_RUNNING: The report is still being processed. You may want to wait and check again later.EVENT_REPORT_STATUS_SUCCEEDED: The report is ready for download. You can access the report using the provided URI.EVENT_REPORT_STATUS_FAILED: The report generation has failed. Log this error and handle it according to your application's requirements.
Here is a sequence diagram to illustrate the process of fetching and downloading summary reports: