Metrics & Dashboard
By default, BlendVision's analytics module provides pre-defined metrics with various dimensions and pre-built dashboard, derived from your audience's interactions with BlendVision player iframe and SDKs, empowering you to gain valuable insights into your content's performance effortlessly.
Metrics
| Metrics | Units | Definition |
|---|---|---|
| Views | - | The total number of times your content has been accessed and viewed by your audience. |
| Watch Time | hrs | The amount of time that viewers watched video content, excluding paused time. |
| Unique Viewers | - | The estimated number of individuals who have watched your content, as determined by the count of unique device ID¹. |
| Avg. View Duration | hrs | The estimated average hours watched per view (total watch time / total number of views). |
| Avg. Viewer Views | - | The estimated average views per viewer (total views / unique viewers). |
| Unique Customer ID | - | The estimated number of individuals who have watched your content, as determined by the count of unique customer ID². |
¹Device ID is generated by the BlendVision player by default:
²
Customer ID allows you to identify viewers by custom parameters defined on your ends (e.g. your existing membership system), refer to here for more integration guide.Dimension
All of the defined metrics are able to be identified and broken down by the following dimension attributes:
| Dimension | Definition and Attribute |
|---|---|
| Content | The VOD or livestream which is playing. |
| Streaming Type | The type of content: |
| Timestamp | The time when the viewer start playing your content. |
| Viewer | The viewer who is playing your content. By default, the player will identify different viewers with device IDs. You are also able to define your own customer IDs for each viewer. |
| Device | The type of device and operating system used by the viewer to play your content: |
| Geo-Region | The region where the viewer plays the video. |
Dashboard
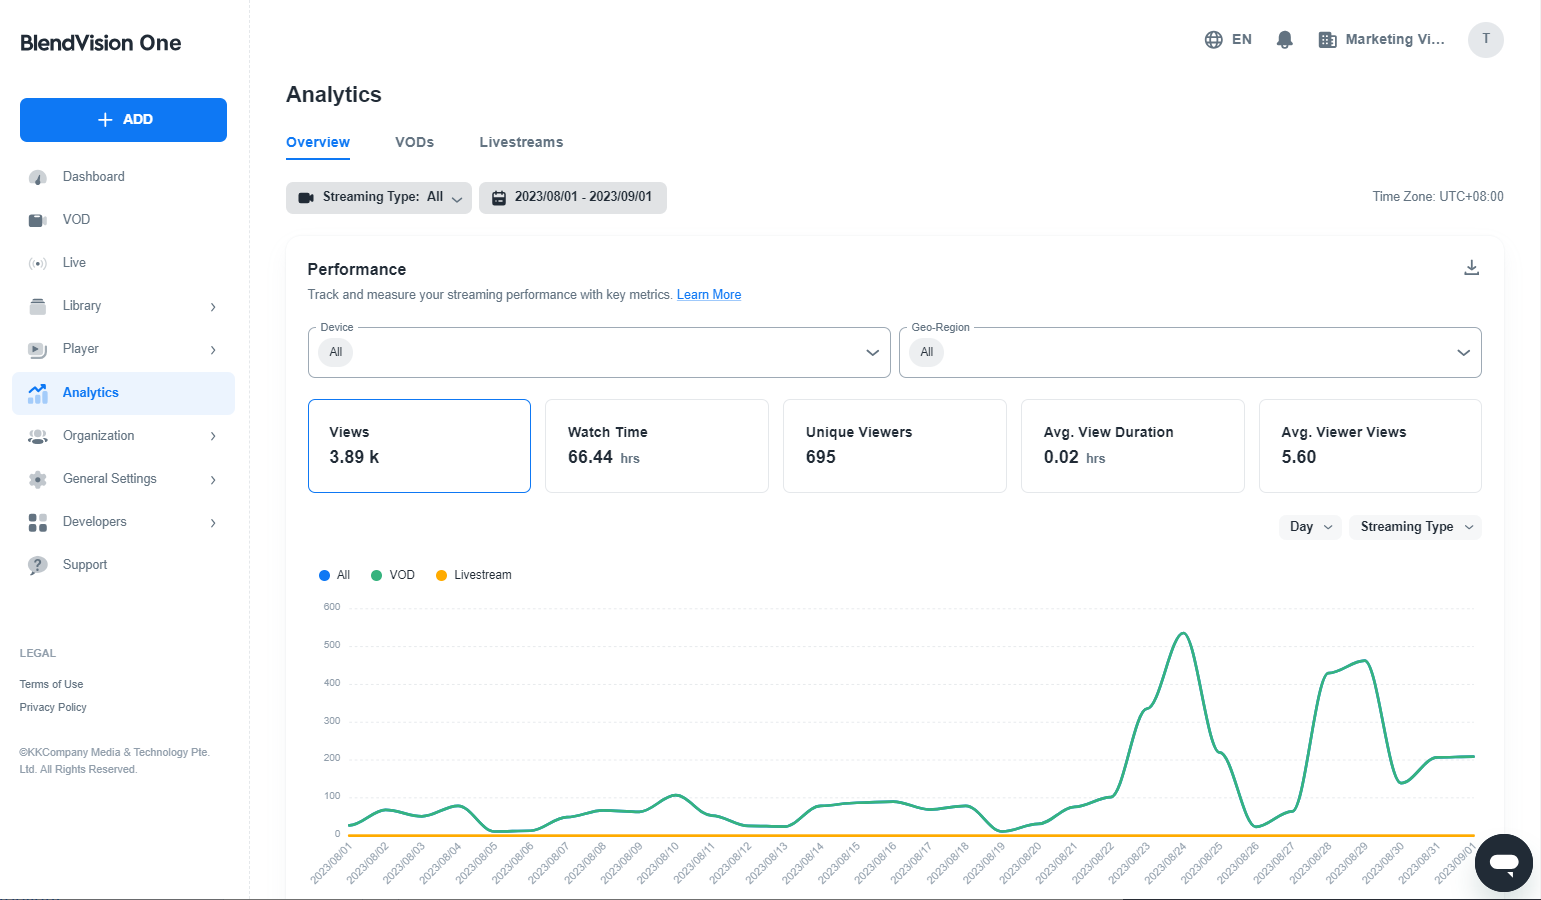
Login to your BlendVision One console > Navigate to Analytics
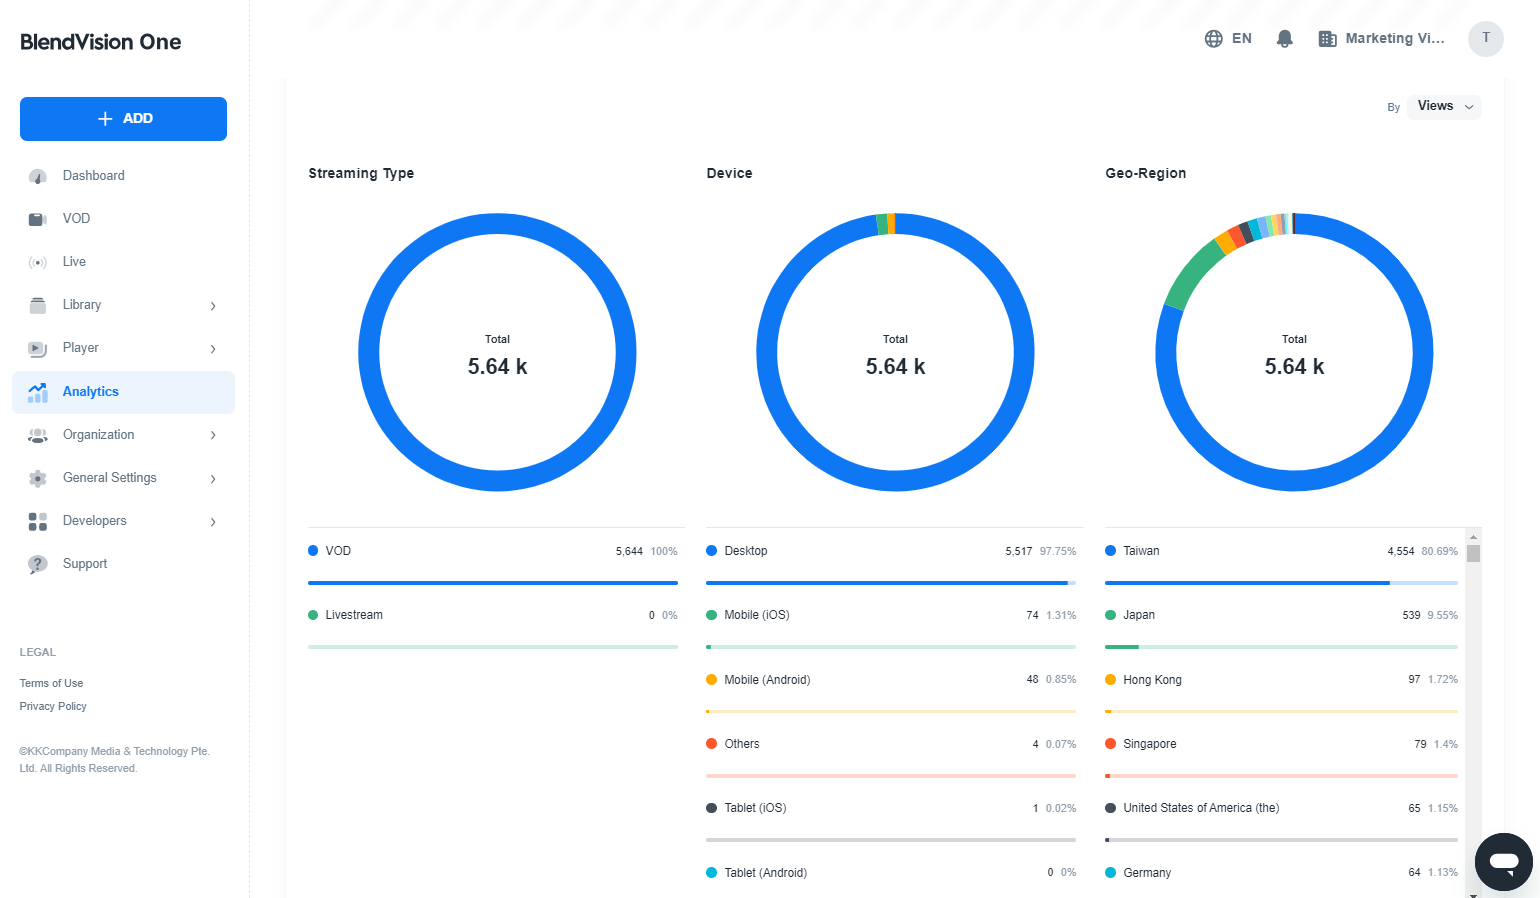
In the Overview tab, you can obtain the time series and segamentaion analysis of the metrics
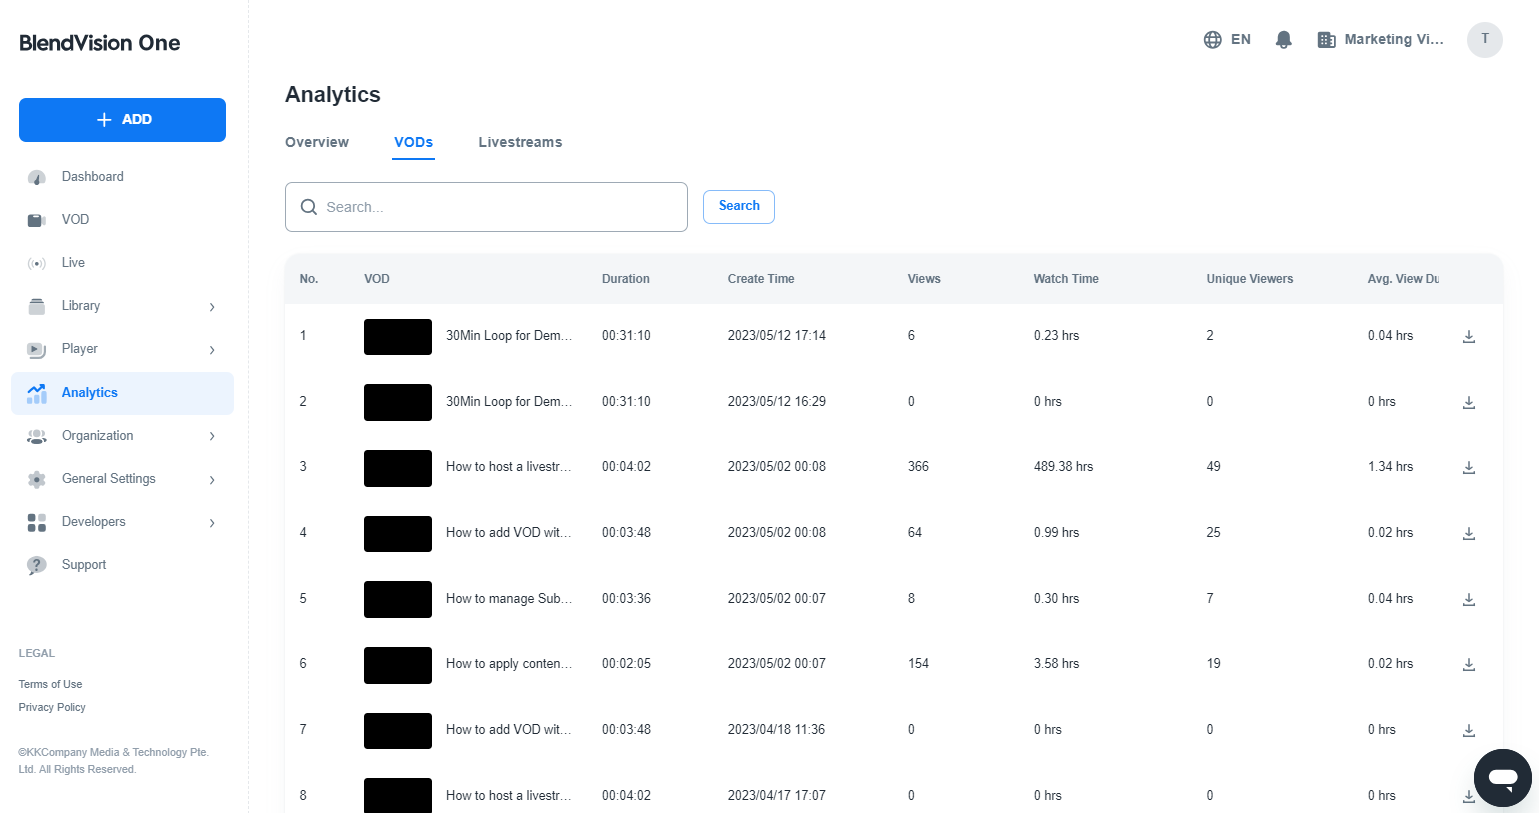
In the VODs tab, you can obtain the metrics for each of the VODs
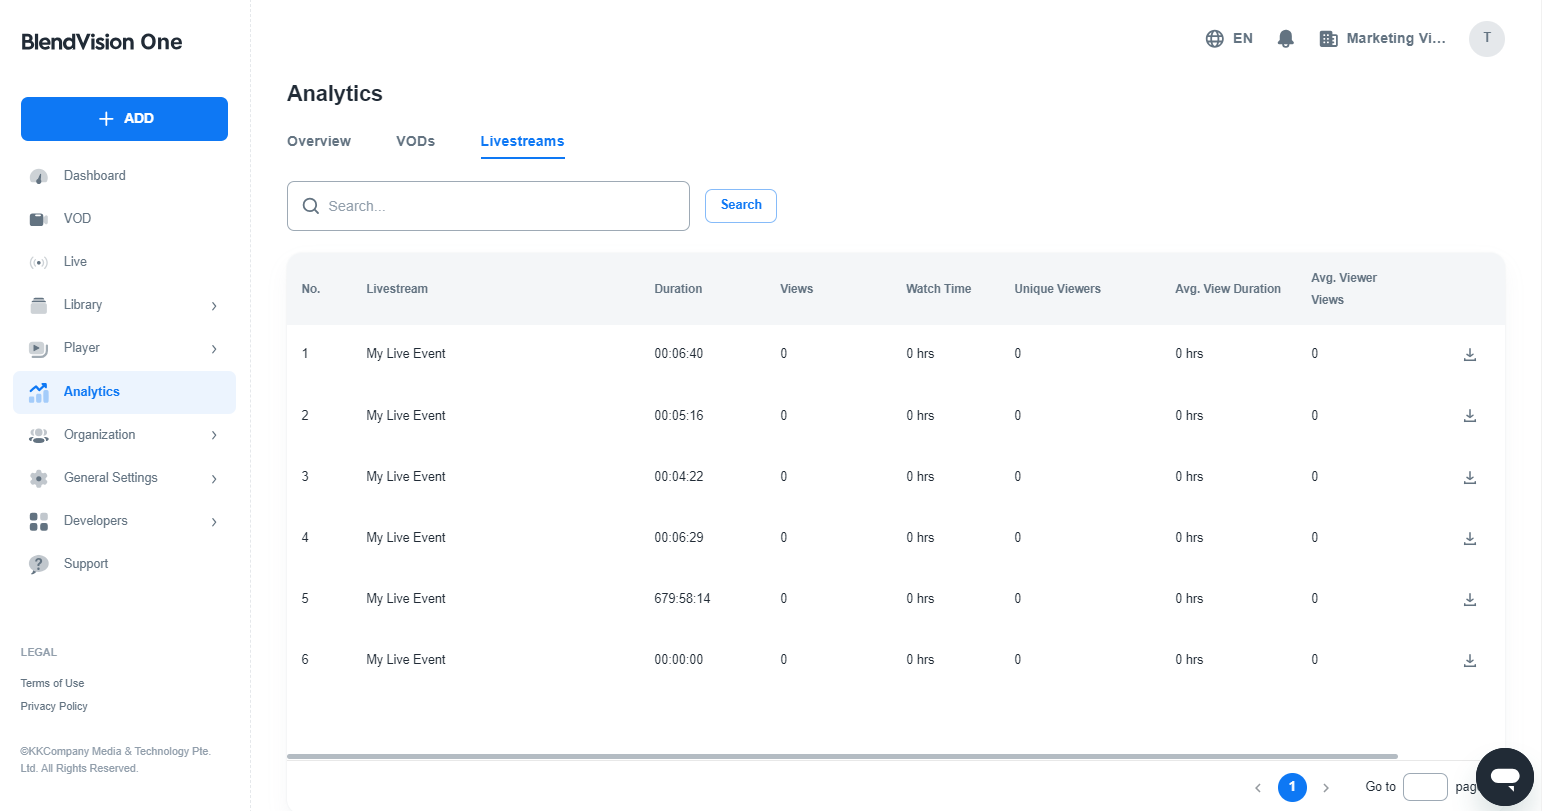
In the Livestreams tab, you can obtain the metrics for each of the Livestreams